  |
 |
     |

|

 |
|
| |
UNDERSTANDING THE RESULTS AND INTERPRETING THE MAP:
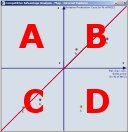 The resulting Competitive Advantage map has the following axes: the horizontal x-axis represents the Relative Maximum
acceptable Sales Price (in % of the MIC). The vertical y-axis represents the Relative Production Cost (in % of
the MIC). The axes cross at the following coordinate: (1,1).
The resulting Competitive Advantage map has the following axes: the horizontal x-axis represents the Relative Maximum
acceptable Sales Price (in % of the MIC). The vertical y-axis represents the Relative Production Cost (in % of
the MIC). The axes cross at the following coordinate: (1,1).
Being positioned on the upper left quadrant (A) can be fatal (high production costs and low accepted sales price).
If your product is situated in the lower right quadrant (D), you are within the ideal zone : low production costs and the
market accepts a high sales price. You have both an internal and an external competitive advantage.
Positioned on the lower left quadrant (C) reflects a cost domination tactic (low production costs and low accepted
sales price).
The positions on the upper right quadrant (B) can result in a differentiation strategy: you have relatively high
production costs but your customers are willing to pay for your product's distinctive qualities. You clearly have an external
competitive advantage.
The bisector separates the advantageous positions from the unfavorable positions.
| |
|
|
 |
|
|
|
Home
About
Contact
Legal Notice
© Copyright, 2001-, by Laurent Müllender. All rights reserved. |
|
|